Q1 2026 Washington DC Market Report
For additional statistics, download the full report
Market Overview
The Washington DC office market remained under pressure in Q1 2026, recording -234,546 square feet of negative absorption. This is an improvement from the steep losses posted in Q4 2025, but still an indicator of suspended demand. Despite these figures, the overall vacancy rate has remained flat over the past few quarters and currently sits at 22.0%. This suggests stabilization driven in part by inventory reduction, including office-to-residential conversions. Flight-to-quality trends also persisted during the quarter, with tenants favoring newer assets, while older properties continue to face the greatest leasing challenges.Rental rate trends were mixed in Q1 2026, with overall pricing showing slight downward pressure. The average full-service rent declined -0.32% from last quarter to $58.71 per square foot, bringing year-to-date growth to -2.25%. Class B led the decline, falling -0.13% to $49.09 per square foot, while Trophy rents remained relatively flat, increasing 0.22% to $83.48 per square foot. In contrast, Class A rents posted a 2.38% quarterly increase to $61.53 per square foot, reflecting ongoing demand for higher quality space despite broader market softness.
Investment and leasing activity remained subdued this quarter, underscoring continued investor interest in well-located CBD assets. In total, three sales exceeding 100,000 square feet closed in the CBD during the quarter. Stream Realty Partners’ acquired 2001 M Street from Brookfield; a joint venture between Carr Properties and Barings purchased 1401 New York Avenue NW; and Douglas Development Corporation purchased 1341 G Street NW. Large leases were limited in the first quarter, with no transactions exceeding 100,000 square feet. Two bright spots for the DC market were seen by Howard University’s new 94,717 square foot sublease at 650 Massachusetts Avenue in the East End submarket and the Washington Commanders’ new 60,000 square foot lease at 2200 Pennsylvania Avenue NW.
Quarterly Key Performance Indicators
- Net Absorption: (234,546) SF
- Direct Asking Rent: $58.71/SF
- Vacancy: 22.0%
Market Data
Market Insights
The Washington, DC office market posted 234,546 square feet of negative absorption, extending a prolonged period of contraction, albeit at a more moderate pace than the past two quarters. Class A properties led losses with -254,621 square feet of negative absorption, with Class B assets close behind at -165,272 square feet. Trophy assets continued their momentum, with 192,265 square feet of positive absorption. The CBD and Georgetown submarkets experienced the largest pullbacks, giving back 188,986 square feet and 106,019 square feet, respectively. The West End submarket was a rare silver lining for the District, with 110,992 square feet of positive absorption. Since 2020, the District has given back more than 8 million square feet of occupied space.
Following nearly a decade of sustained development, Washington DC’s construction pipeline has slowed to a complete halt. Weak tenant demand, rising construction costs, and broader economic hindrances have collectively caused this deceleration. While recently delivered Trophy assets have continued to outperform older inventory in attracting tenants, the sharp pullback in new development may limit future relocation opportunities and prolong challenges for lower class buildings. As of Q1 2026, no office projects are actively under construction- a significant decline from the 2017 peak, when more than six million square feet were underway. Looking ahead, the Trophy pipeline remains extremely limited, consisting of just two highly pre-leased projects by BXP: 725 12th Street NW in the East End, slated for delivery in 2028, and 2100 M Street NW, in the CBD, expected to deliver in 2031.
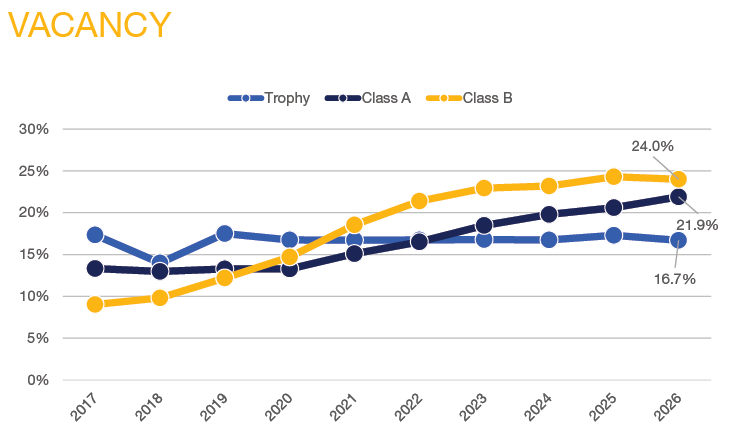
The flight-to-quality trend remains a defining feature of the Washington, DC office market, with Trophy buildings continuing to outperform Class A and Class B properties. As of Q1 2026, Trophy vacancy declined 60 basis points quarter-over-quarter to 16.7%, reflecting sustained tenant demand for newer, highly amenitized space in prime locations. When looking at Trophy vacancy in just the CBD and East End submarkets, that figure drops to 12.4%. In contrast, Class A properties saw vacancy edge higher by 130 basis points to 21.9%, while Class B vacancies declined 30 basis points but remained the highest of all the classes at 24.0%. Overall vacancy remains largely unmoved within the past two years. Top-tier assets continue to capture a disproportionate share of leasing activity, while older buildings face persistent challenges.


Sublease Report
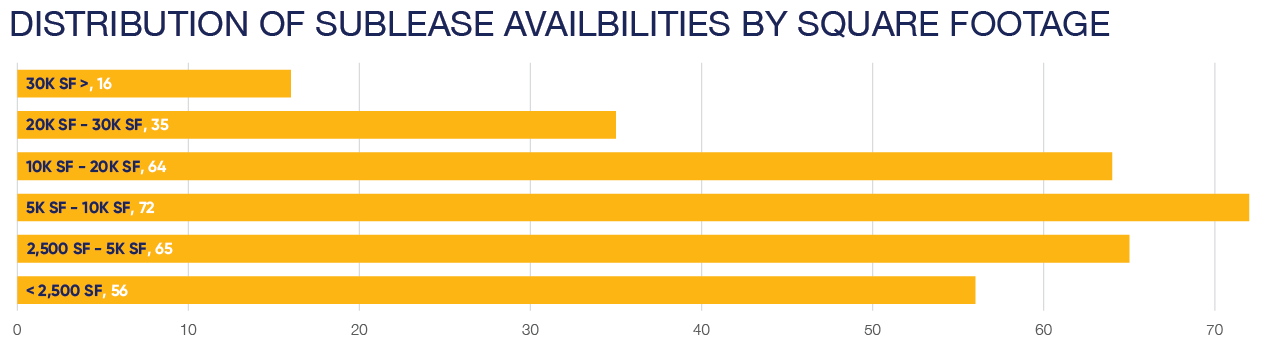
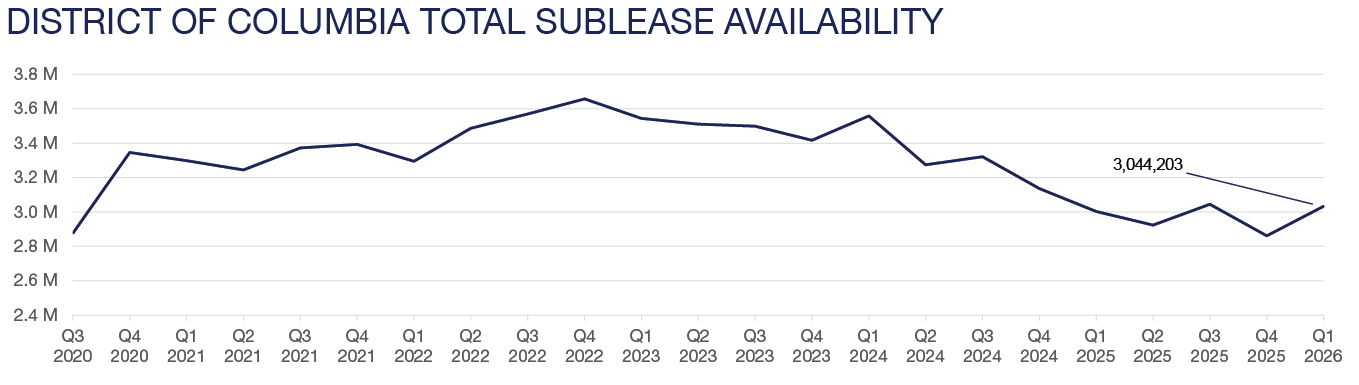
The sublease market in Washington, DC continues to play a significant role in the overall office market landscape. Currently, there are approximately 300 sublease spaces available across the District, totaling over 3.0 million square feet of inventory. Roughly 65% of these spaces range from 2,500 to 20,000 square feet, offering a variety of flexible options for tenants with diverse space requirements. The East End and CBD remain the dominant areas, accounting for 64% of the total available sublease space across the District.
Pricing for sublease spaces varies, with 32% of the current offerings asking between $35.00 and $55.00 per square foot. The majority of subleases in the market are priced at a significant discount compared to direct spaces, putting further pressure on landlords as they compete for tenants in the market. The breakdown of lease term lengths further reflects the market’s dynamics, with nearly 70% of subleases offering terms of 5 years or less. These varied term lengths contribute to the flexibility tenants seek in the current market.
Sublease activity in Q1 was concentrated in the downtown core, where the CBD and East End collectively added 29 new spaces, against only 10 removals. This resulted in a large combined net increase of roughly 100,000 square feet across the two submarkets. Meanwhile, Southwest and Capitol Hill listed only one space each, totalling only 20,343 square feet of new space added this quarter. In the District overall, sublease availability rose by about 171,000 square feet, reflecting continued pressure even amidst natural expirations and withdrawals.
GSA Downsizing Disruption
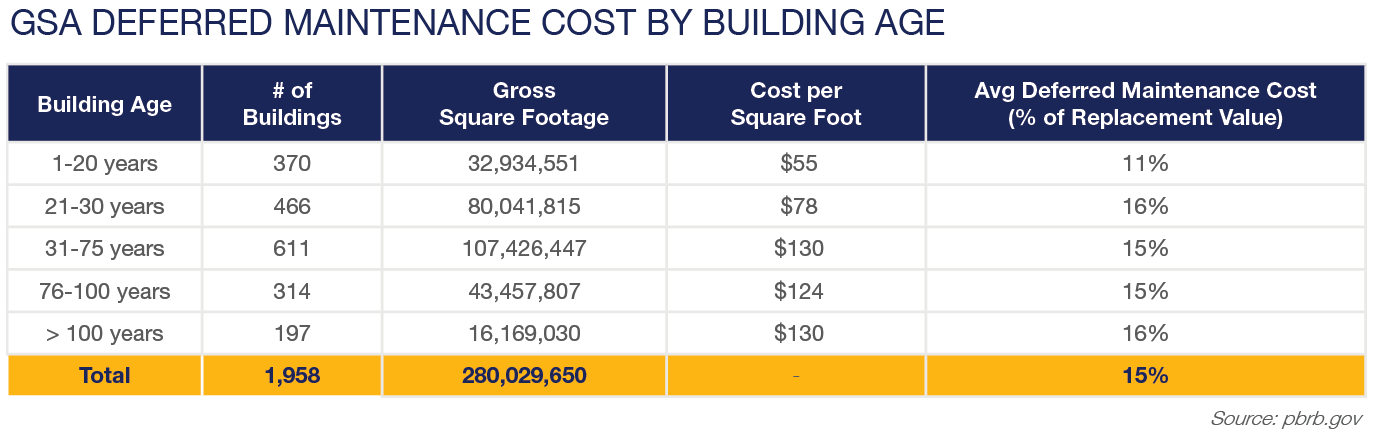
General Service Admistration’s (GSA’s) ongoing effort to offload and right-size its DC portfolio has the potential to materially impact DC market fundamentals, as the agency is actively evaluating millions of square feet for disposition. While the GSA is working to significantly downsize their portfolio nation-wide, their impact is sure to be far more pronounced in the Washington, DC region. With more than 50 million square feet of GSA occupied space (leased and owned), the region far outpaces any other market across the country. Since the beginning of President Trump’s second term, DOGE has been urging federal efficiency changes. Additionally, the USE IT Act, passed in 2025 to address GSA’s utilization of their assets, mandates a 60% utilization threshold. The GSA’s entire portfolio falls below this level, and as such, ongoing consolidation is more than likely. The additional planned dispositions, coupled with the concentration of upcoming lease expirations in core submarkets such as the CBD, Southwest, and NoMa, have the potential to quickly shift supply-demand dynamics. At the same time, rising deferred maintenance costs, estimated at roughly $50 billion across GSA’s portfolio, are reinforcing the economic case for accelerated dispositions, suggesting this trend will persist rather than taper.
- Net Absorption: (234,546) SF
- Direct Asking Rent: $58.71/SF
- Vacancy: 22.0%
Download the full report to learn more.