Q1 2025 Washington DC Market Report
For additional statistics, download the full report
Market Overview
The Washington, DC office market maintained modest momentum in Q1 2025, posting 367,616 square feet of positive net absorption and reducing the overall vacancy rate by 20 basis points to 20.0%. This follows a strong Q4 2024, when the market recorded 770,221 square feet of positive absorption, marking the first quarterly gain since 2022. While leasing activity declined to 1.17 million square feet in Q1—representing a 39% decrease year-over-year—law firms continued to lead demand, accounting for 44% of total leasing volume.
Noteworthy transactions included McDermott Will & Emery’s 151,899-square-foot prelease at 725 12th Street NW in the East End, Freshfields’ 117,432-square-foot relocation to 1100 15th Street NW in the CBD, and the District of Columbia Government’s 101,982-square-foot renewal at 250 E Street SW in the Southwest submarket. A significant factor in the market’s dynamics was the termination of the full-building lease for the U.S. Agency for Global Media at 1875 Pennsylvania Avenue NW. This move contributed nearly 300,000 square feet of negative absorption in the CBD submarket during the first quarter, highlighting ongoing shifts in federal agency leasing.
Rental rates showed mixed trends. The overall average rate declined 2.08% quarter-over-quarter to $60.06 per square foot. Class A space averaged $61.90 per square foot, down 3.1% year-to-date, while Class B declined 2.95% to $50.09 per square foot. Trophy assets, however, showed resilience with an increase of 2.14% from the previous year, reaching an average of $83.37 per square foot.
Quarterly Key Performance Indicators
- Net Absorption: 367,616 SF
- Direct Asking Rent: $60.06/SF
- Vacancy: 20.0%
Notable Regional Insights
- The DOGE termination of nearly 700 federal leases is contributing to increased office vacancies and potential market instability
- US Agency for Global Media backed out of a 290,000 square foot, 15-year lease at 1875 Pennsylvania Avenue, signed in September
Market Data
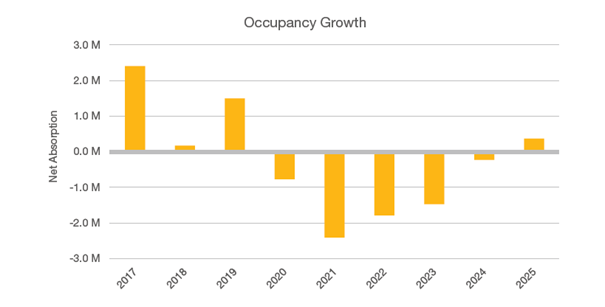
Occupancy Trends
The Washington, DC office market continued its recovery in Q1 2025, posting 367,616 square feet of positive net absorption, building on the 770,000 square feet absorbed in Q4 2024—the first growth since Q4 2022. Trophy-class buildings saw 33,233 square feet of positive absorption, maintaining momentum from Q4. Class B properties saw strong recovery, with 418,512 square feet absorbed, including 324,726 square feet in the East End. Class A results were mixed: the East End absorbed 485,520 square feet, but the CBD experienced a loss of 398,895 square feet, leading to an overall decline of 84,129 square feet in Class A absorption. The development pipeline remains at its lowest level in 20 years, with no significant office deliveries so far in 2025. This slowdown will continue to ease some of the pressure from rising inventory levels as the market continues to adapt to shifting tenant demand and evolving workplace dynamics.
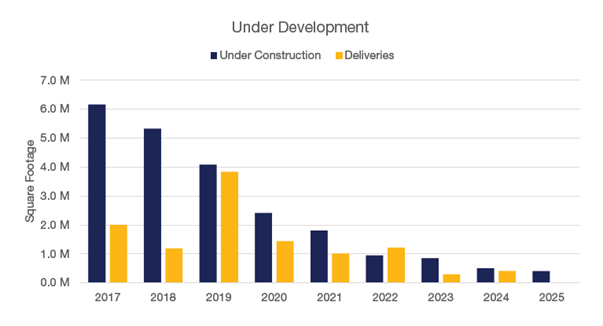
Construction Snapshot
Following nearly a decade of consistent development, the construction pipeline in the DC market has leveled off significantly. Lack of organic tenant demand, coupled with escalating construction costs and broader economic challenges, are key factors contributing to the slowdown in office projects. Notably, while new trophy deliveries have attracted greater leasing activity compared to existing buildings, the decline in new product coming to market may have a ripple effect on lower-class buildings as tenants reassess their relocation needs. In fact, no new construction projects were completed in the first quarter of 2025, and only ~400,000 square feet remains under development—a drastic drop from the peak in 2017, when over six million square feet were under construction. Stonebridge and Rockefeller Group’s 600 5th Street NW is currently the only project underway in Washington, DC. The redevelopment, 52% preleased to Crowell & Moring, is expected to be delivered in early 2026.
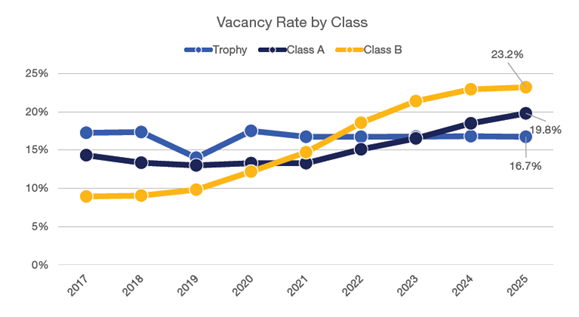
Market Vacancy
The flight-to-quality trend remains a defining feature of the Washington, D.C. office market, with trophy buildings consistently outperforming Class A and Class B properties. As of Q1 2025, trophy buildings report a vacancy rate of 16.7%, a decrease of 20 basis points from 16.9% in 2024. In contrast, Class A properties saw an increase in vacancy, rising by 130 basis points from 18.5% in 2024 to 19.8% in Q1 2025. Class B buildings also experienced a slight increase, with vacancies rising by 30 basis points from 22.9% in 2024 to 23.2% in Q1 2025. This disparity highlights the strong demand for premium office spaces, as tenants prioritize high-quality, well-located buildings that meet modern workplace needs. The contrast between rising vacancies in Class A and Class B buildings vs. declining rates in trophy properties underscores the increasing demand for top-tier office space in the DC market.
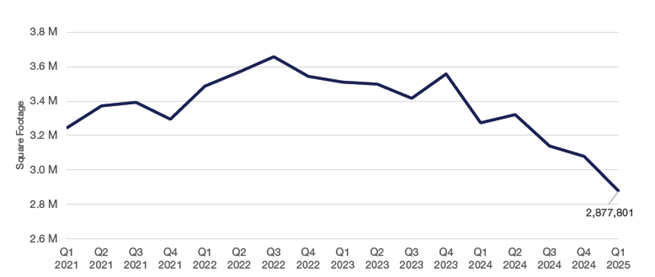
Sublease Report
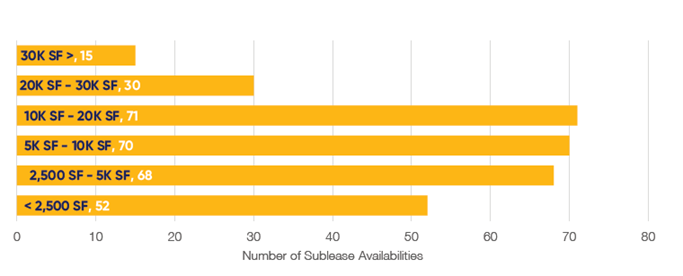
The sublease market in Washington, DC continues to play a significant role in the overall office market landscape. Currently, there are approximately 297 sublease spaces available across the District, totaling nearly 3.1 million square feet. Roughly 48% of these spaces range from 5,000 to 20,000 square feet, offering a variety of flexible options for tenants with diverse space requirements. The East End and Central Business District (CBD) remain the dominant areas, accounting for 61% of the total available sublease space in the district. Pricing for sublease spaces varies, with 19% of the current offerings asking between $35.00 and $55.00 per square foot. The majority of subleases in the market are priced at a significant discount compared to direct spaces, putting further pressure on landlords as they compete for tenants in the market. The breakdown of lease term lengths further reflects the market’s dynamics, with 75% of subleases offering terms of 5 years or less. These varied term lengths contribute to the flexibility tenants seek in the current market.
A combined 325,000 square feet of new sublease space was added across the CBD and East End submarkets in the fourth quarter. Of that total, the CBD accounted for 17 new spaces totaling nearly 100,000 square feet, while the East End added 22 spaces totaling over 225,000 square feet. However, the overall sublease market still experienced a net reduction of approximately 60,000 square feet, signaling slower absorption and sustained pressure on the market.
Change in Sublease Availability by Year
Distribution of Sublease Availabilities by SF
DOGE Lease Termination Analysis
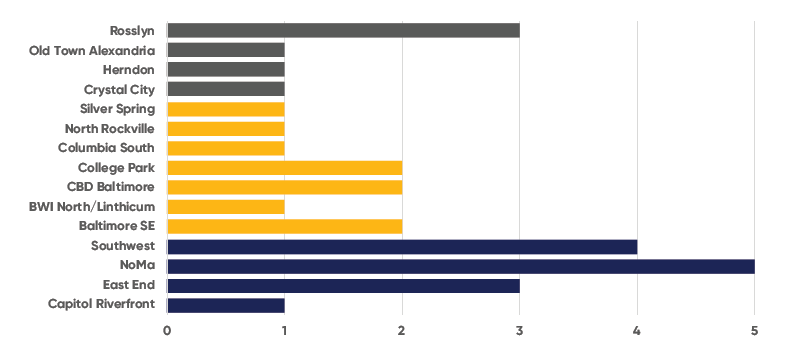
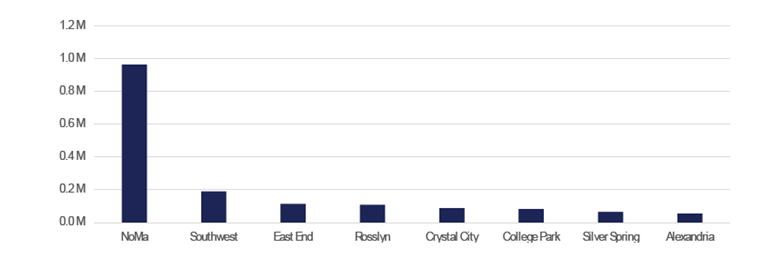
Since DOGE (Department of Government Efficiency) began publishing lease termination data, the DMV region (D.C., Maryland, and Northern Virginia) has accounted for 29 terminated leases, totaling 1,753,406 square feet. These terminations translate to roughly $64.6 million in annual rent savings for the federal government. The bulk of the space reductions are concentrated in D.C., with several high-profile agencies pulling back from longstanding locations. This trend could lead to increasing vacancy rates in the affected submarkets, amplifying recent trends. Tenants stand to gain opportunity from what could be a softer market and additional space opportunities in previously limited or premium buildings - potentially with favorable lease terms as landlords look to backfill large blocks of vacancy.
Number of Lease Terminations by Submarket
Top Submarkets by Terminated Square Footage
Download the full report to learn more.