Q2 2026 Washington DC Market Report
For additional statistics, download the full report
Market Overview
The Washington, DC office market returned to positive territory in Q2 2026, recording 229,543 square feet of positive net absorption. This improvement was driven in part by the city’s continued leadership in redevelopment activity and office-to-residential conversions, which have helped stabilize market conditions by reducing available inventory. The overall vacancy rate remained relatively flat, declining just 10 basis points quarter-over-quarter to 21.9%.
Rental rates remained relatively stable in Q2 2026, with only modest changes across all building classes. The average full-service rental rate increased 0.59% quarter-over-quarter to $59.06 per square foot, bringing year-to-date change to -1.64%. Class A rents rose 0.59% to $61.89 per square foot, while Class B rents decreased 0.17% to $49.01 per square foot. Trophy properties saw the largest jump in rent, increasing 0.62% to $84.00 per square foot.
This continued strength reflects sustained demand for high-quality space despite broader softness in the office market.
Leasing activity rebounded during the quarter, driven by strong law firm demand, which accounted for approximately 600,000 square feet of leasing volume. Investment activity remained below pre-pandemic levels as investors continued to navigate uncertainty around office valuations. Notable sale transactions included Jemal’s Equities’ acquisition of 99 M Street SE, the Government of Algeria’s purchase of 1441 L Street NW, and ExecuRental’s acquisition of 401 14th Street SW from the GSA. On the leasing front, White & Case completed one of the largest office deals in recent years, while Honigman signed a new lease at 1999 K Street NW, doubling its footprint.
Quarterly Key Performance Indicators
- Vacancy: 21.9%
- Net Absorption: 229,543 SF
- Direct Asking Rent: $59.06/SF
Market Insights
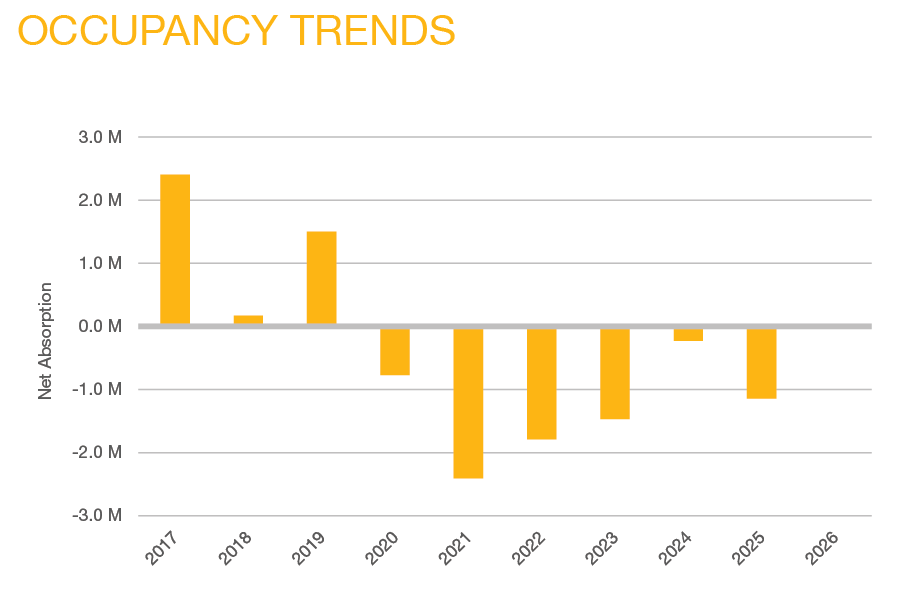
In Q2 2026, the Washington, DC office market recorded 229,543 square feet of positive net absorption. This ended a prolonged period of contraction. Trophy properties led performance with 280,648 square feet of occupancy gains, continuing their recent momentum. Class A assets posted a modest gain of 15,979 square feet, while Class B properties recorded 59,214 square feet of negative absorption. By submarket, Uptown experienced the largest pullback, giving back 157,479 square feet of occupancy. In contrast, the East End and CBD remained strong performers, together recording 442,423 square feet of occupancy gains during the quarter.
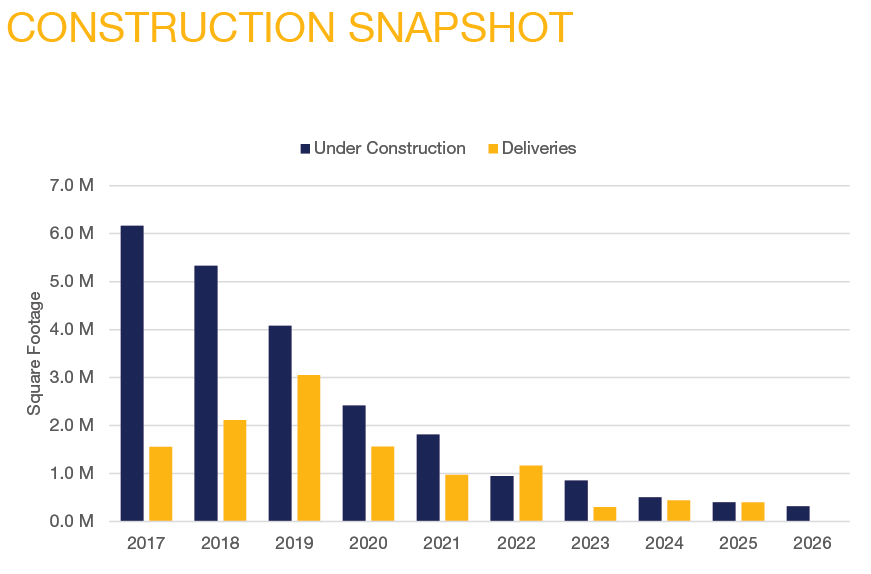
Construction activity in Washington, DC has declined significantly over the past decade, driven by weak tenant demand, rising construction costs, and broader economic headwinds. While recently delivered Trophy assets have continued to outperform older inventory in attracting tenants, the sharp slowdown in new development may limit future relocation opportunities and prolong leasing challenges for lower-tier buildings. As of Q2 2026, construction has commenced on a single Trophy development at 725 12th Street NW, adding approximately 320,000 square feet to the pipeline. The project is fully pre-leased by law firms McDermott Will & Emery and Cooley LLP.
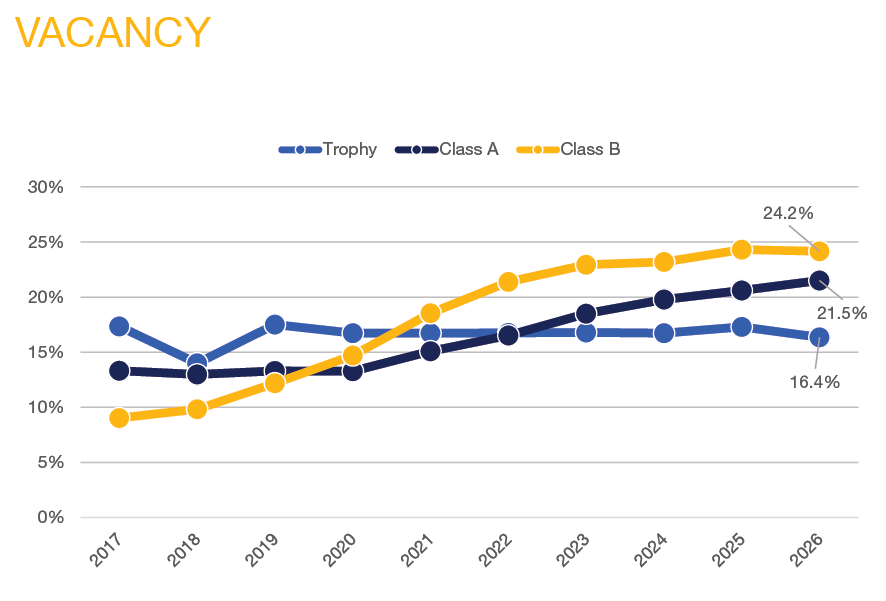
The flight-to-quality trend remains a defining feature of the Washington, DC office market, with Trophy assets continuing to outperform Class A and Class B properties. As of Q2 2026, Trophy vacancy declined 70 basis points quarter-over-quarter to 16.0%, reflecting sustained demand for newer, highly amenitized space in prime locations. When looking at Trophy vacancy in just the CBD and East End submarkets, that figure drops to 12.0%. Class A properties also improved, with vacancy declining 60 basis points to 21.4%, while Class B vacancy remained unchanged at 24.3%, the highest among all classes. Overall vacancy has remained largely stable over the past two years. Top-tier assets continue to capture a disproportionate share of leasing activity, while older buildings face persistent leasing challenges.
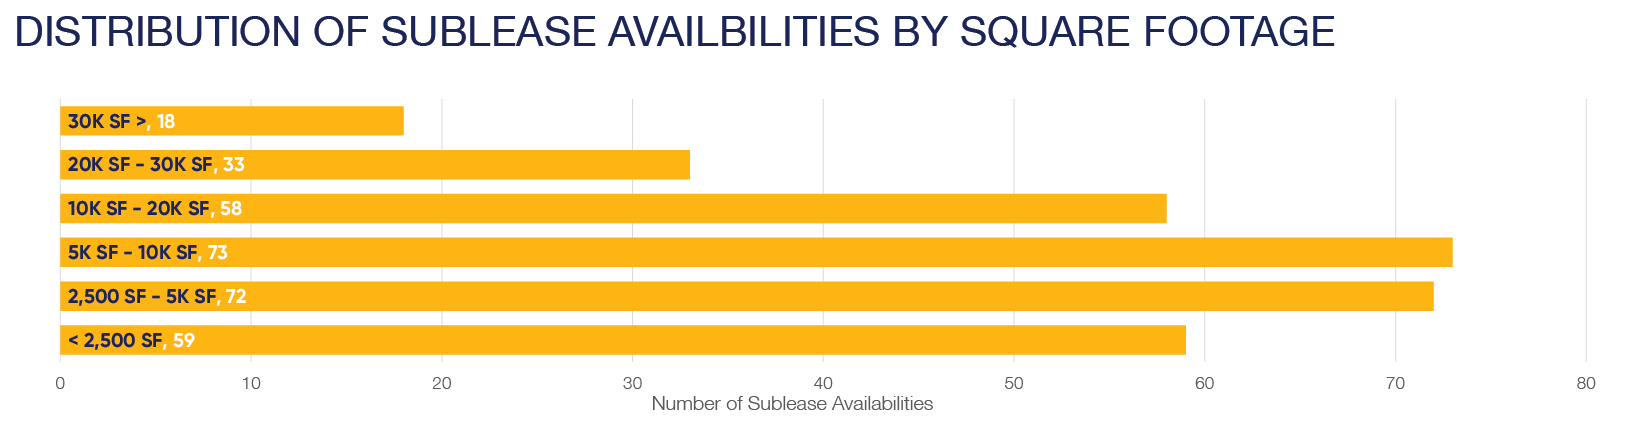
Subleasing continues to play a significant role in DC office market
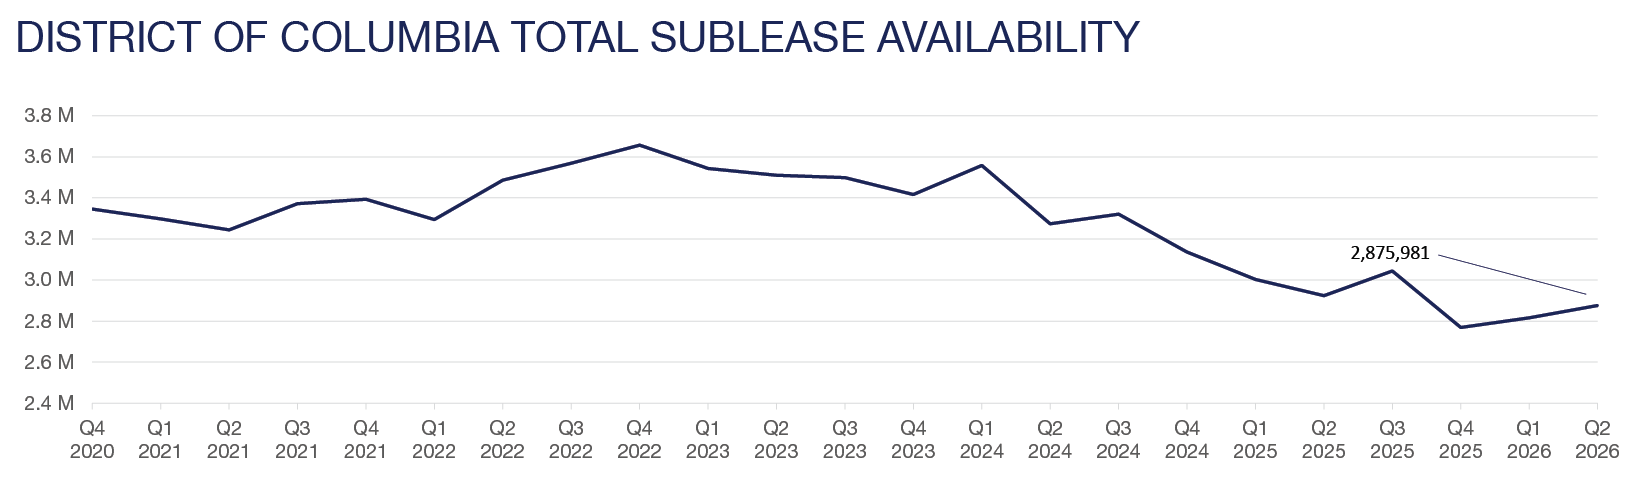
The sublease market in Washington, DC continues to play a significant role in the overall office market landscape. Currently, there are approximately 313 sublease spaces available across the District, totaling over 2.8 million square feet of inventory. Roughly 65% of these spaces range from 2,500 to 20,000 square feet, offering a variety of flexible options for tenants with diverse space requirements. The East End and CBD remain the dominant areas, accounting for 67% of the total available sublease space across the District.
Pricing for sublease spaces varies, with 42% of the current offerings asking between $35.00 and $45.00 per square foot. The majority of subleases in the market are priced at a significant discount compared to direct spaces, putting further pressure on landlords as they compete for tenants in the market. The breakdown of lease term lengths further reflects the market’s dynamics, with nearly 70% of subleases offering terms of 5 years or less. These varied term lengths contribute to the flexibility tenants seek in the current market.
The East End saw a lot of sublease activity in Q2 2026. The Washington Post listed 174,359 square feet of its headquarters at 1301 K St NW. Meanwhile, Meta withdrew about 125,000 square feet of sublease space from 575 7th St NW; both these buildings are in the East End. Capitol Riverfront and Capitol Hill listed only 2 spaces each, totaling only 14,318 square feet of new space added this quarter. In the District overall, sublease availability increased by about 59,871 square feet from Q1 2026, reflecting continued pressure even amidst natural expirations and withdrawals.
Federal Investment in the Nation’s Capital
As the 4th of July approached, the federal government increasingly stressed the importance of improving the nation’s Capitol. The current administration’s goal is to present DC favorably for visitors coming to celebrate America’s 250th birthday and who visit for years to come. This effort reflects a shift toward more centralized federal control over land use in DC, with the National Park Service serving as a lead construction authority. The broader aim is to position DC as a national stage rather than simply a city, where streets, parks, and monuments function not only as infrastructure but also as symbols of capital investment and national identity.
The beautification efforts aim to increase tourism, boost consumer spending, and enhance Washington, DC’s image as the nation’s capital. If completed efficiently and maintained over the long term, these investments could generate meaningful economic benefits by attracting additional visitors, encouraging private investment, and supporting local businesses. However, the initiatives have also drawn criticism regarding their cost, funding sources, and whether certain projects represent the most effective use of public resources.
For additional statistics, download the full report.